Homogeneity analysis report
Backgroud
Rice (Oryza sativa L.) Accurate evaluation of the genetic background of the variety/strain is essential for variety validation and identification. Traditional molecular marker methods have problems such as limited genome coverage and insufficient representation of genetic characteristics of varieties in variety identification. This function builds a variety homogeneity analysis platform based on about 6K rice public variety datasets.
Homogeneity is a concept commonly used in statistics to evaluate the uniformity of biological tissues, as opposed to heterogeneity. If a biological tissue consists of units with the same characteristics, then the organization can be said to be homogeneous. Extended to varieties, if a variety is composed of individuals with the same or close characteristics, then the variety is homogeneous, and the estimation of the uniformity of individuals within the variety is the assessment of breed homogeneity. Studies have shown that the average remains of multiple samples Transmission differences can better represent the genetic polymorphisms of a variety, which in turn can provide more adequate support for the analysis of basic genetic differences within varieties for the assessment of breed homogeneity (1). The analysis of the following population genetic parameters is an indicator of the homogeneity analysis of this platform:
- Nucleotide sequence diversity (nucleotide diversity, π) represents the difference in mean nucleotide levels at a single site between any two sequences. Originally proposed in studies comparing nucleotide substitution rates between two DNA sequences in mitochondrial DNA restriction sites in similar species, it is now mainly used to measure nucleotide-level polymorphisms in populations (2).
We selected 5 indica rice and 5 japonica rice varieties from the national variety bank of China Rice Institute (10 varieties in total) to observe the growth uniformity in field planting. Each cultivar: 5 single strains were randomly selected for genome resequencing (a total of about 360 Gb of data was generated, with an average sequencing depth of 16 ×). At the same time, the genomic data of 15 rice cultivars were screened from public databases (the same variety but the genomic data submission units were different, the number of units ≥ 3 samples with an average sequencing depth ≥ 3×) for the validation of the evaluation method in this study.
The analysis of genetic differences within and between varieties in 10 national variety banks, using phylogenetic tree and other analysis, found that the differences between rice varieties were significantly greater than those within varieties, and there was a certain threshold for genomic differences between individuals within a single variety. Nucleotide sequence diversity (π) was further used to analyze the intra-variety differences, and π was used as an index to evaluate the homogeneity of varieties: among the 10 re-sequenced varieties, the average inter-individual π values in 5 japonica cultivars were less than 0.009 (which was used as the evaluation threshold), The internal threshold is approximately 0.026. Based on the average π values within 15 varieties in the public database, its distribution is basically consistent with the threshold obtained by sequencing in this study. Through the analysis of the sliding window distribution of the whole genome heterozygous rate of individuals, it is found that the variation distribution pattern between individuals within the variety is consistent, but the distribution between varieties is obvious, so the concept of "genome-wide heterozygous rate polymorphism fingerprint" is proposed, which provides a new idea for the homogeneity assessment and variety validation of rice varieties.
Introduction to the Homogeneity analysis process
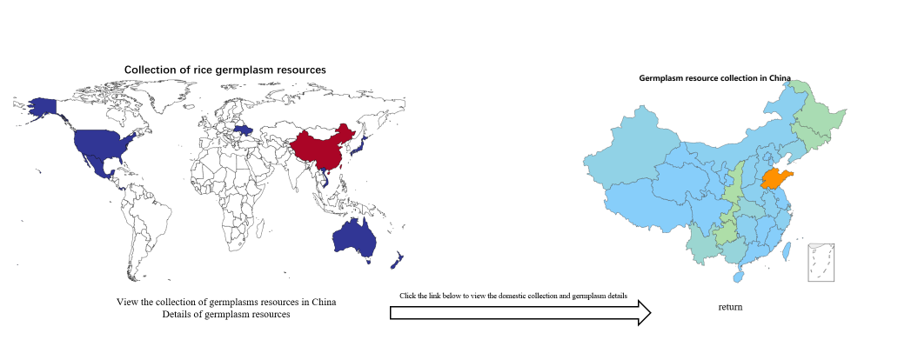
Figure 1
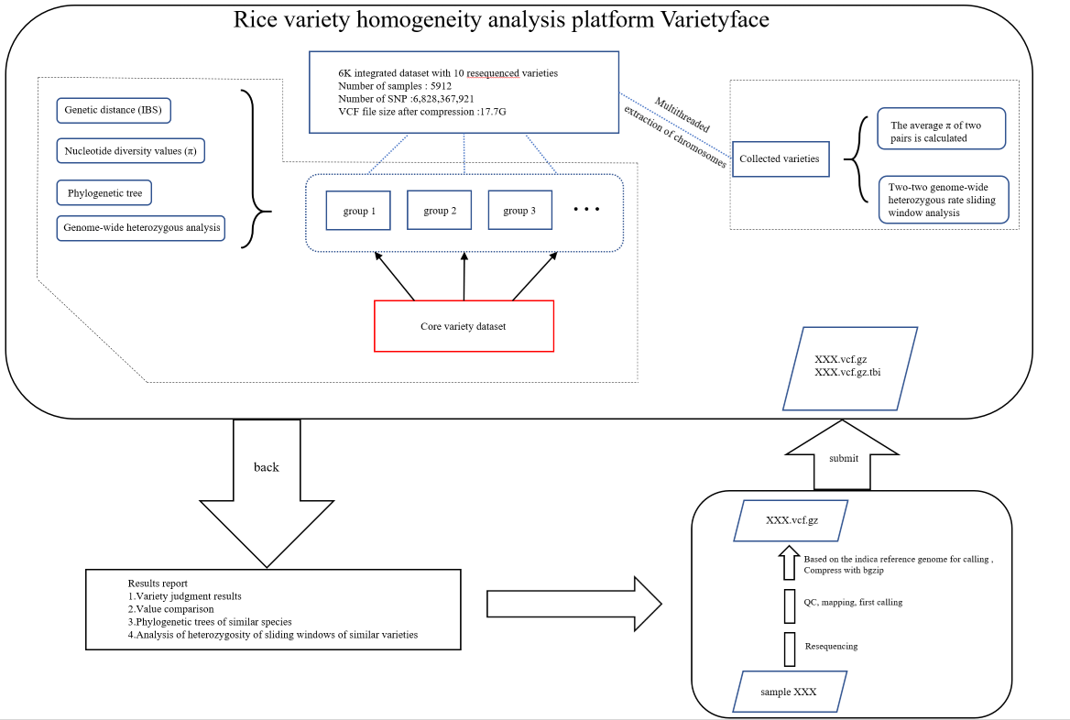
Figure 2
- First, the user resequenced NGS of the material to be detected (denoted XX here) for quality control, and the Japonica rice genome Nipponbare (IRGSP-1.0) was used as the reference genome for comparison and mutation detection (5). Follow QUAL ≥ 30, DP ≥ 10, QD ≥2, and the minimum allele frequency (max) is 0.05 missing) 0.8 standard filters the mutation site. After the obtained VCF file is compressed by bgzip, it is submitted through the web end of this platform.
-
The homogeneity analysis platform mainly provides two types of analysis:
-
If the information of XX varieties is unknown, or may be a new variety, the homogeneity of the whole variety will be compared. These include:
- Firstly, XX is compared with the "core variety" set to determine the core variety closest to it and the corresponding grouping of the core variety.
- After the grouping was determined, XX was compared with all varieties in the specified group, and the combination (XX and YY) with the lowest diversity of two-pair nucleotide sequence was analyzed for genome-wide sliding window heterozygosity.
- XX builds an evolutionary tree with all the varieties grouped. If XX and YY meet the three conditions that the evolutionary tree is closely in the same branch, the diversity of two nucleotide sequences is below the threshold, and the genome-wide sliding window heterozygous rate distribution pattern is the same, it can be judged that the varieties of XX and YY are very homogeneous and likely to be the same variety.
- If the XX variety information is known, and the corresponding variety is included in this platform, XX will only conduct homogeneity analysis with the corresponding variety in the platform, and finally the nucleotide sequence diversity of the two and the genome-wide sliding window heterozygosity analysis results will be obtained. Finally, after the variety homogeneity assessment task is completed, the system automatically packages the analysis results and reports to the email address submitted by the user for further analysis and evaluation.
-
If the information of XX varieties is unknown, or may be a new variety, the homogeneity of the whole variety will be compared. These include:
Homogeneity analysis results
Pi value - genetic diversity calculation
Take QF15A as an example:
Search the database for the group of rice with the closest homogeneity, and this table is the PI results for your sample and this group of rice homogeneity analysis.
| Sample1 | Sample2 | ave_pi |
|---|---|---|
| IRIS_313-9114__LEUANG 28-1-87__indica__- | QF015A | 0.0024573735516361 |
| IRIS_313-12036__CHAN LEUY__indica__- | QF015A | 0.0025423194251965 |
| IRIS_313-11817__KHAOSAING__indica__- | QF015A | 0.0025614194535639 |
| IRIS_313-11079__PHAN PHAE__indica__- | QF015A | 0.0025647251418275 |
| IRIS_313-11242__OR 117-8__indica__- | QF015A | 0.0027215932898784 |
| IRIS_313-10825__KEMA 5__indica__- | QF015A | 0.0027403481477665 |
| IRIS_313-11260__ARC 13591__indica__- | QF015A | 0.002887409524819 |
| IRIS_313-10980__DUDHSAR__indica__- | QF015A | 0.0029968187418653 |
| IRIS_313-11486__KHAGRAI DIGHA__indica__- | QF015A | 0.0030383499392857 |
| B221__Fanhaopi__indica__饭毫皮 | QF015A | 0.0030524407536887 |
| CX108__Ziri__indica__- | QF015A | 0.0032812338554353 |
| IRIS_313-11598__GODADANI__indica__- | QF015A | 0.0032878443389043 |
| 6fe1d5f1.0__SAMPATTI__indica__- | QF015A | 0.0033669674142816 |
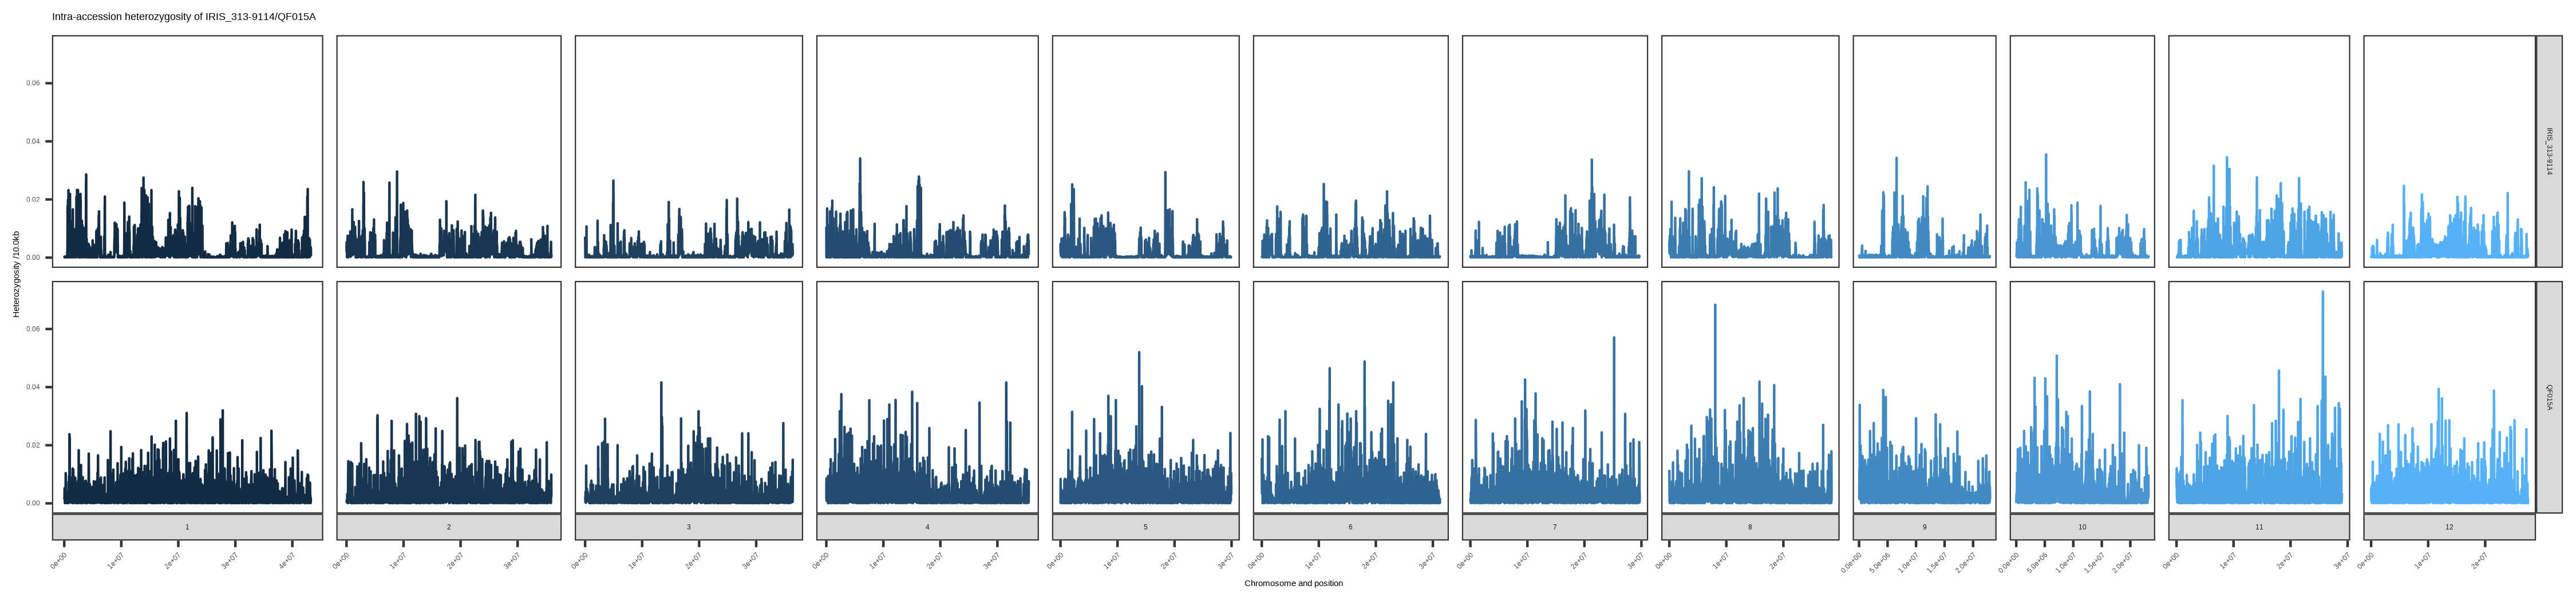
Genome-wide heterozygous rate sliding window
According to the window size of 10Kb, the platform calculates the genome-wide nucleotide sequence diversity within the cultivar, as well as the distribution of the genome-wide heterozygosity rate of each individual in the variety, and compares the distribution of differences between individuals within varieties and the trend of genetic diversity between varieties. After homogeneity analysis, your breed is the most similar, and its genome-wide heterozygous rate is shown below:
Phylogenetic tree
The platform will use full variety comparison to determine the varieties most similar to the user sample, search for the most homogeneous group of rice from the database, and build a phylogenetic tree, which users can visualize through the Newick format phylogenetic tree storage file -related.tree
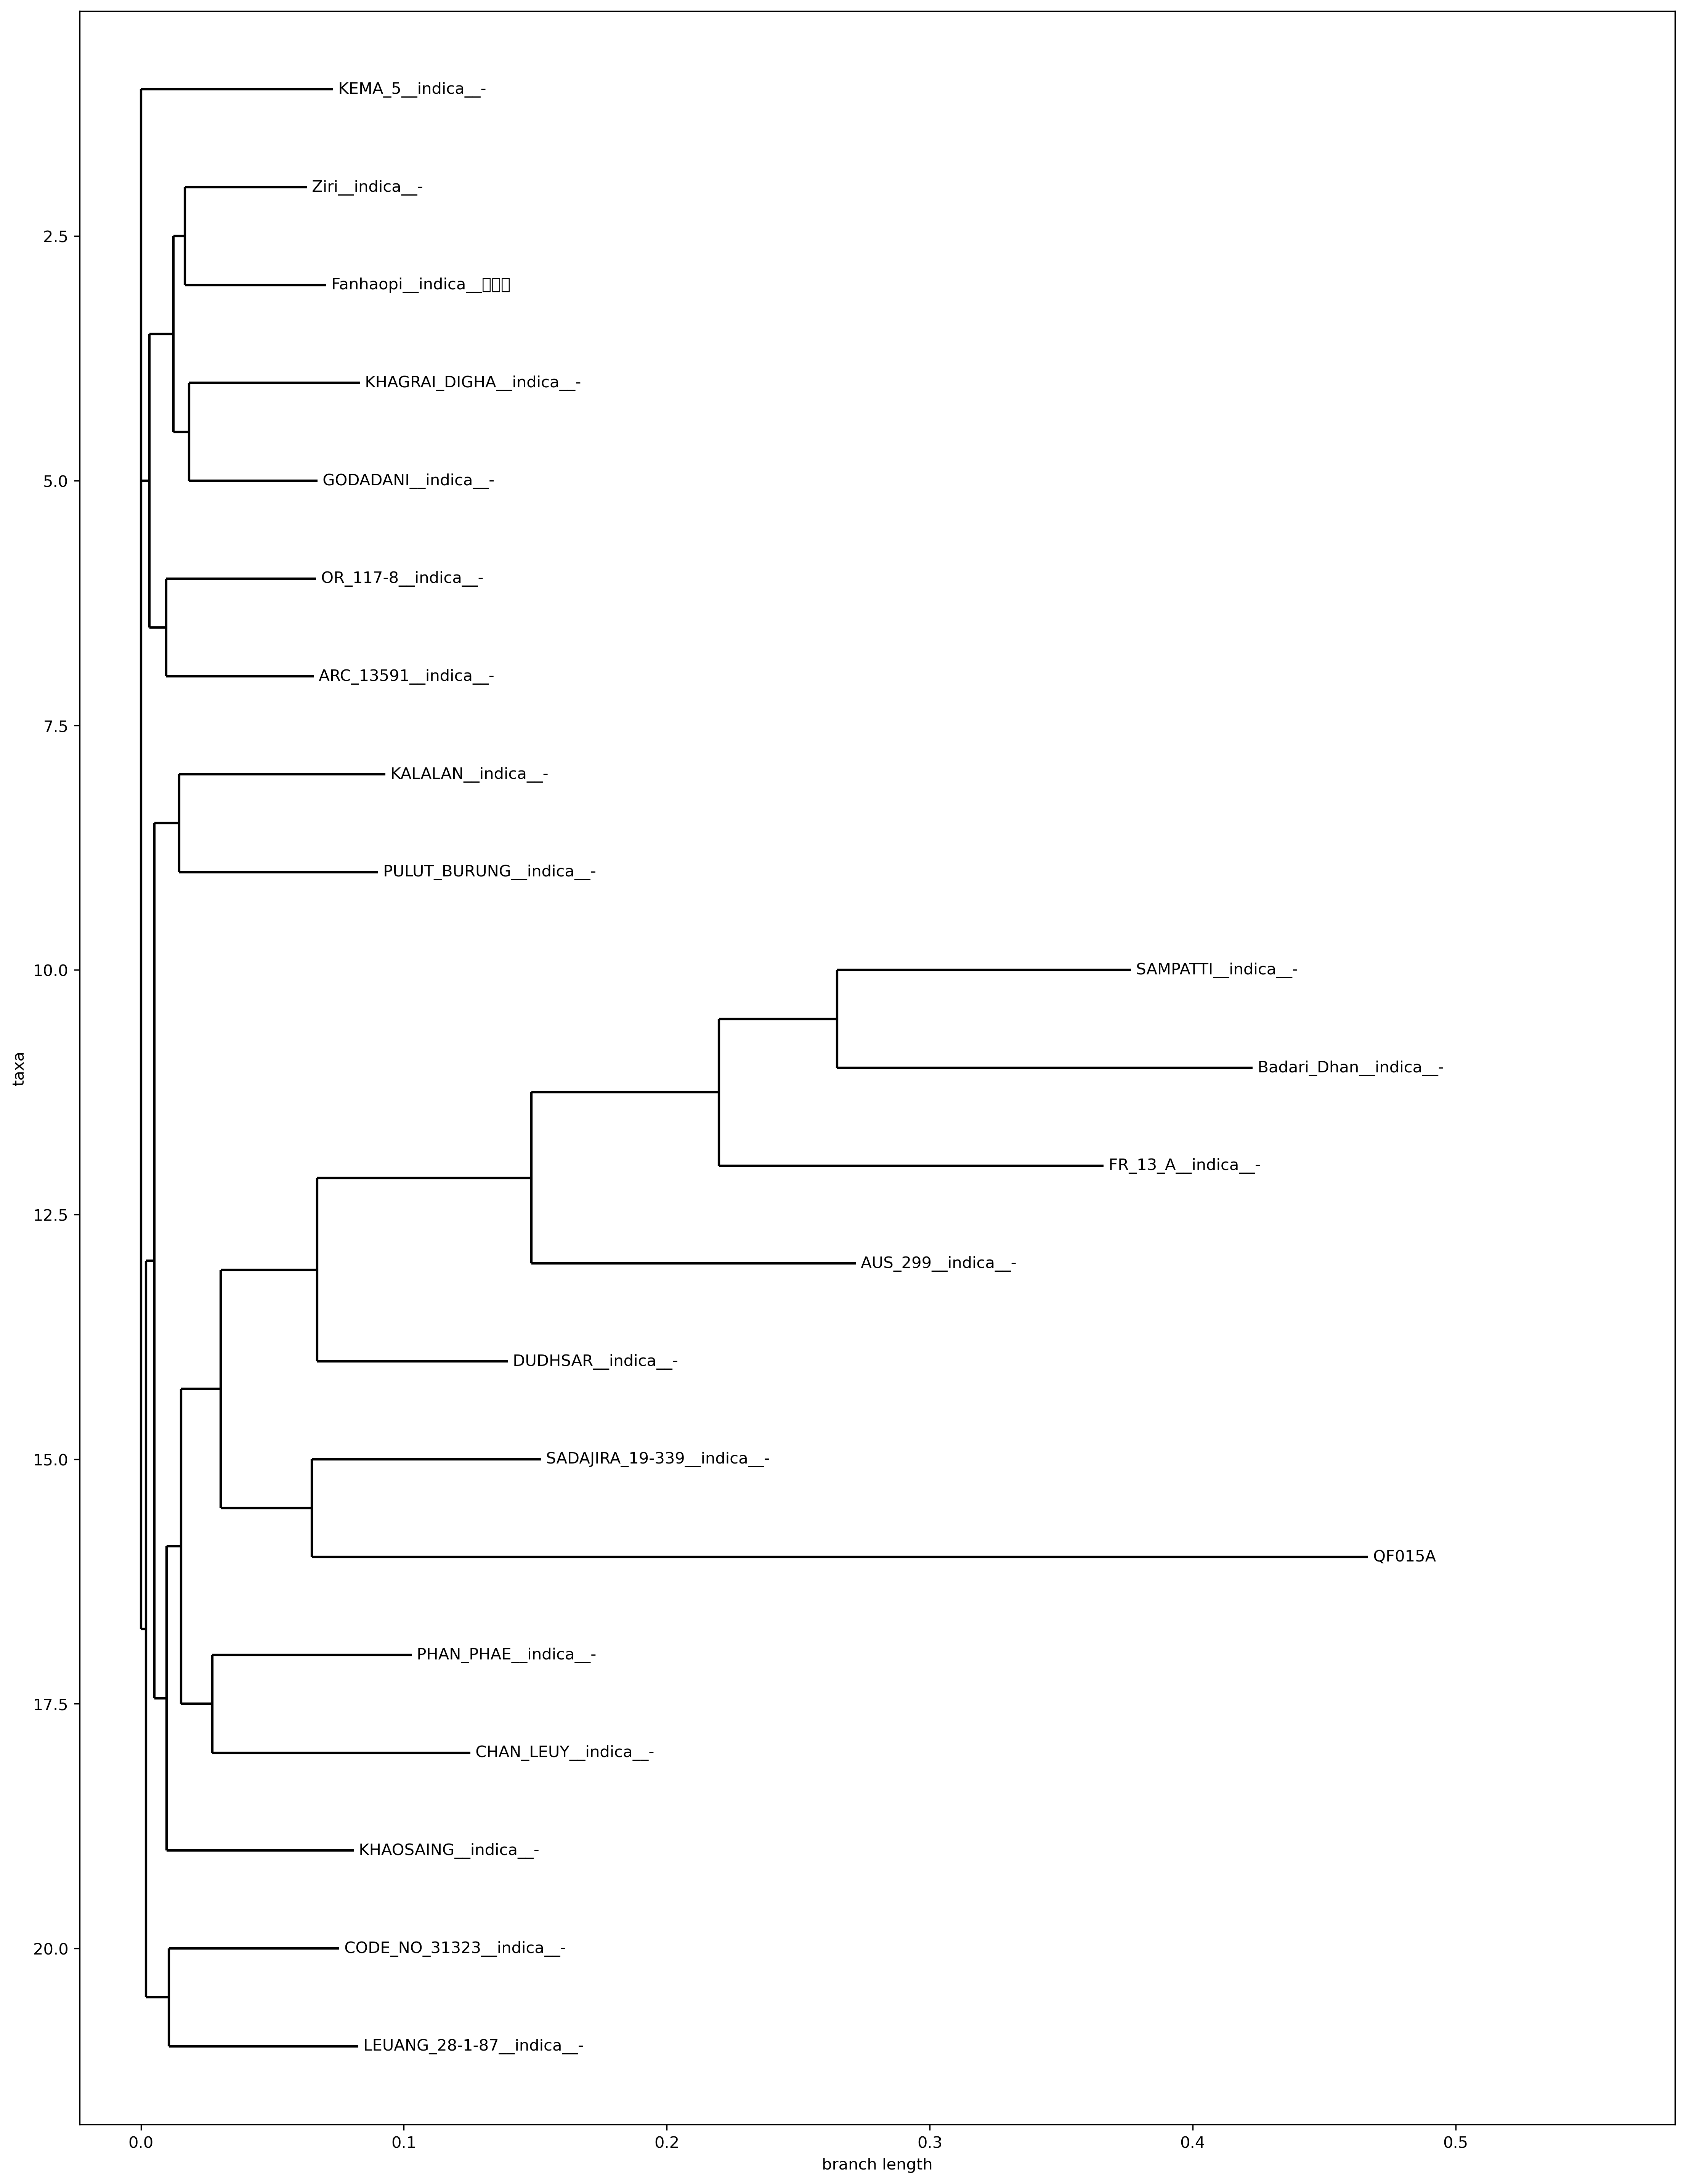
Figure 3
Conclusion
QF015A has the least homogeneity with IRIS_313-9114__LEUANG 28-1-87__indica__- in this database, which is 0.0024573735516361292, which is greater than the threshold of indica of 0.00041, and should not be the same variety. Genome-wide heterozygosity between the two is shown in the plotFigure 2。