Analysis Method
Here describing the source and analysis pipeline of data, as well as the quality assessment of the results.
Data Source Involving the rice resequencing data, the reference genome, as well as TE sequences
All the next-generation sequencing (NGS) data of 3000 rice varieties involved in this study were from 3K Rice Genome Project (The 3000 rice genomes project,2014), and downloaded from the European Bioinformatics Institute (Accession: ERP005654). A total of approximately 17 Tb trimmed, filtered reads were obtained, with an average of 14-fold coverage per accession. The temperate japonica rice Nipponbare were used as the reference genome. The unified-build release Os-Nipponbare-Reference-IRGSP-1.0 (Kawahara et al., 2013) and annotations (Release 7) were downloaded from Rice Genome Annotation Project (http://rice.plantbiology.msu.edu/). A total of 25,546 rice repeat sequences were collected from Repbase (http://www.girinst.org/) and the TIGR Rice Repeat Database (Ouyang & Buell, 2004). After removing non-TEs (e.g. rRNA gene, centromere/telomere repeat sequence), 22,053 TE sequences were finally retained for our study. These TEs represented a broad taxonomic range and covered the long terminal repeat retrotransposons (LTR-RTs) (Copia, Gypsy), non-LTR-RTs (Long Interspersed Nuclear Elements-LINEs and Short Interspersed Nuclear Elements-SINEs) and six DNA transposon superfamilies (PIF/Harbinger, Tc1/Mariner, Mutator, hAT, CACTA and Helitron).
Analysis Pipeline Describing the identification and genotyping of TE loci in rice population
Construction of TE end sequence library
Before alignment, a non-redundant library of TE end sequences was constructed to reduce unnecessary computation by the following steps. Firstly, 100 bp sequences were extracted from both ends of each TE, and then were aligned with each other using the software BLAST+ with the following parameters: “-task blastn -outfmt 6 -evalue 1e-4 -max_target_seqs 100000”; Secondly, a custom Perl script was written to analyze the alignment results to determine which sequences were redundant to each other; Thirdly, for multiple sequences that were redundant to each other, only one of them was retained for library construction. In this way, a total of 4,622 non-redundant sequences from 522 families were finally used for the TE end sequences library.
Identification and genotyping of TE insertions
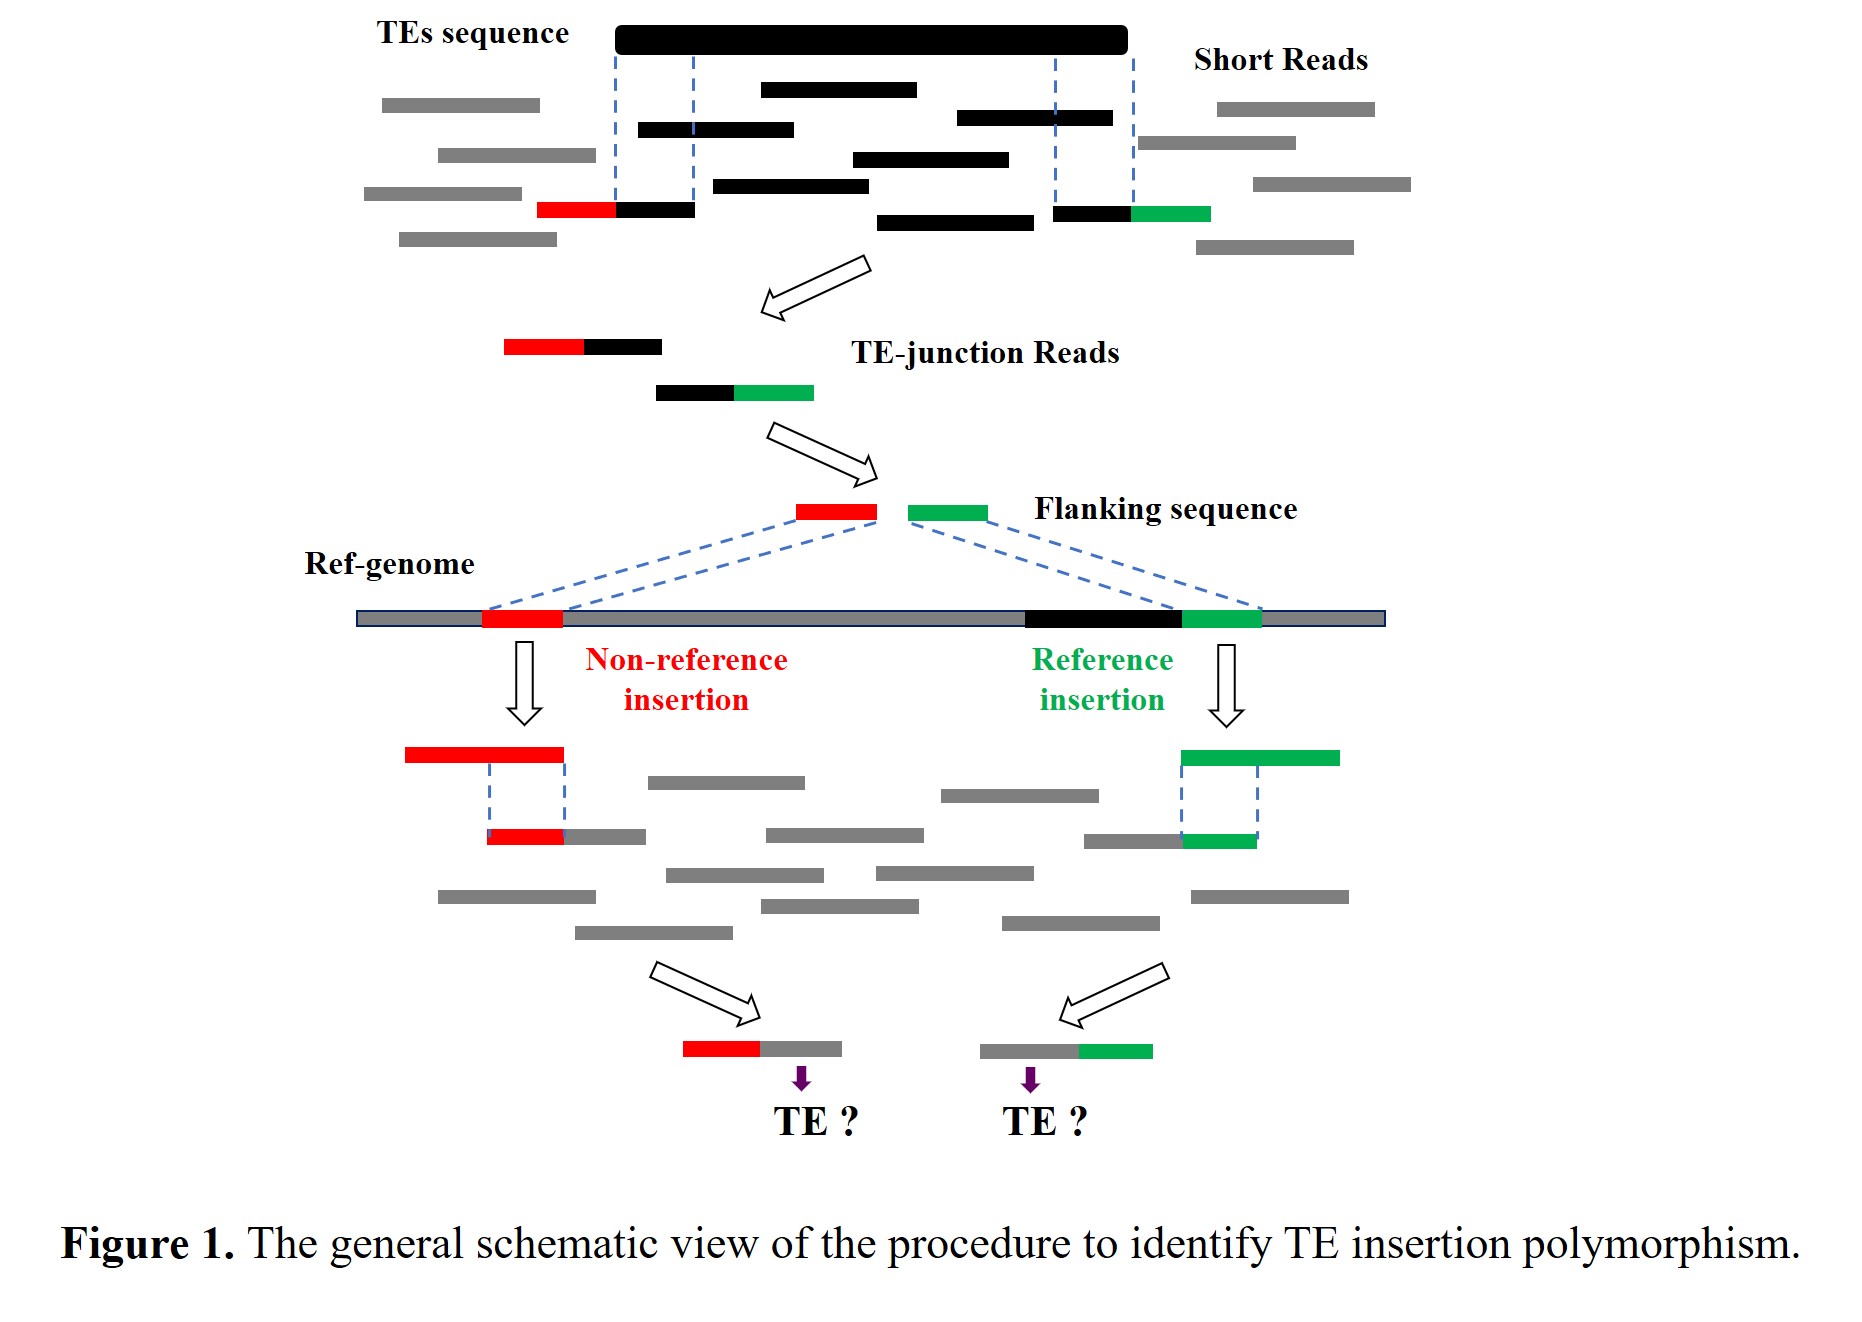
To obtain a comprehensive profile of transposon insertion polymorphisms (TIPs) in rice population, the process of data analysis mainly includes the following two stages: in the first stage, with the Nipponbare genome assembly as a reference, we used next-generation sequencing (NGS) reads to identify TE insertions from the whole rice population; in the second stage, the presence/absence calls for each identified TE locus was carried out in each of 3,000 diverse rice accessions (Figure 1).
In stage one: Firstly, the 83 bp reads of the resequenced accessions were used as queries to search against TE end library by Bowtie2 with the following parameters: “-a -f --local -D 20 -R 3 -N 1 -L 20 -i S,1,0.5 --score-min G,0,9”. Reads with 20~63 bp matching to the ends of TE sequences in the library were considered as TE-junction reads spanning a TE insertion site, which consisted of TE sequences and flanking sequences, and were selected for further analyses via custom Perl scripts. whereas, the reads aligned to TEs sequences with full length were discarded due to lacking adequate information of flanking sequence for proper mapping; Secondly, in order to determine the genomic location of these insertions, the reads retained in the previous step were trimmed off TE portion and then mapped to the Nipponbare reference genome by Bowtie2 with the following parameters: “-a -f”. The reads uniquely mapped to the reference genome were kept; Thirdly, a non-redundant list of TE insertions were achieved by clustering these TE insertion sites according to the information of their genomic location.
For a particular locus, the above analysis merely allowed us to acquire a list of accessions in which TE present. However, the remaining accessions still kept uncertain whether the observed absence of TE insertion was true or was attributable to the lack of sequencing reads. In addition, the sequence divergence between the TE at a particular site and the representative one maybe also miss a small number of accessions carrying TE insertion, which would discount the accuracy of our data. Therefore, we need to further analysis with the following procedures to address precisely these kinds of issues.
In stage two: Firstly, the 100 bp sequences immediately flanking the mapped TE insertions were extracted from the reference genome and grouped into a library (called the flanking sequence library hereafter); Secondly, the 83 bp reads of each resequenced accessions were used as queries to search against the flanking sequence library using Bowtie2 with the following parameters: “-a -f --local -D 20 -R 3 -N 1 -L 20 -i S,1,0.5 --score-min G,0,9”. Reads with 20~63 bp matching to the ends of the flanking sequences were considered as the candidate reads spanning the TE insertion sites, in which only part belong to flanking sequence, and were selected for further analyses via custom Perl scripts; Thirdly, these retained reads were trimmed off the matching portion (the flanking sequence), and then aligned with the end sequence of the corresponding TEs by BLAST+, to determine whether these locations possess the expected TE insertions. In this way, we could characterize the presence and absence of TE insertion at each identified site in individual rice accession.
Result Assessment Presenting three different ways to evaluate the quality of the dataset
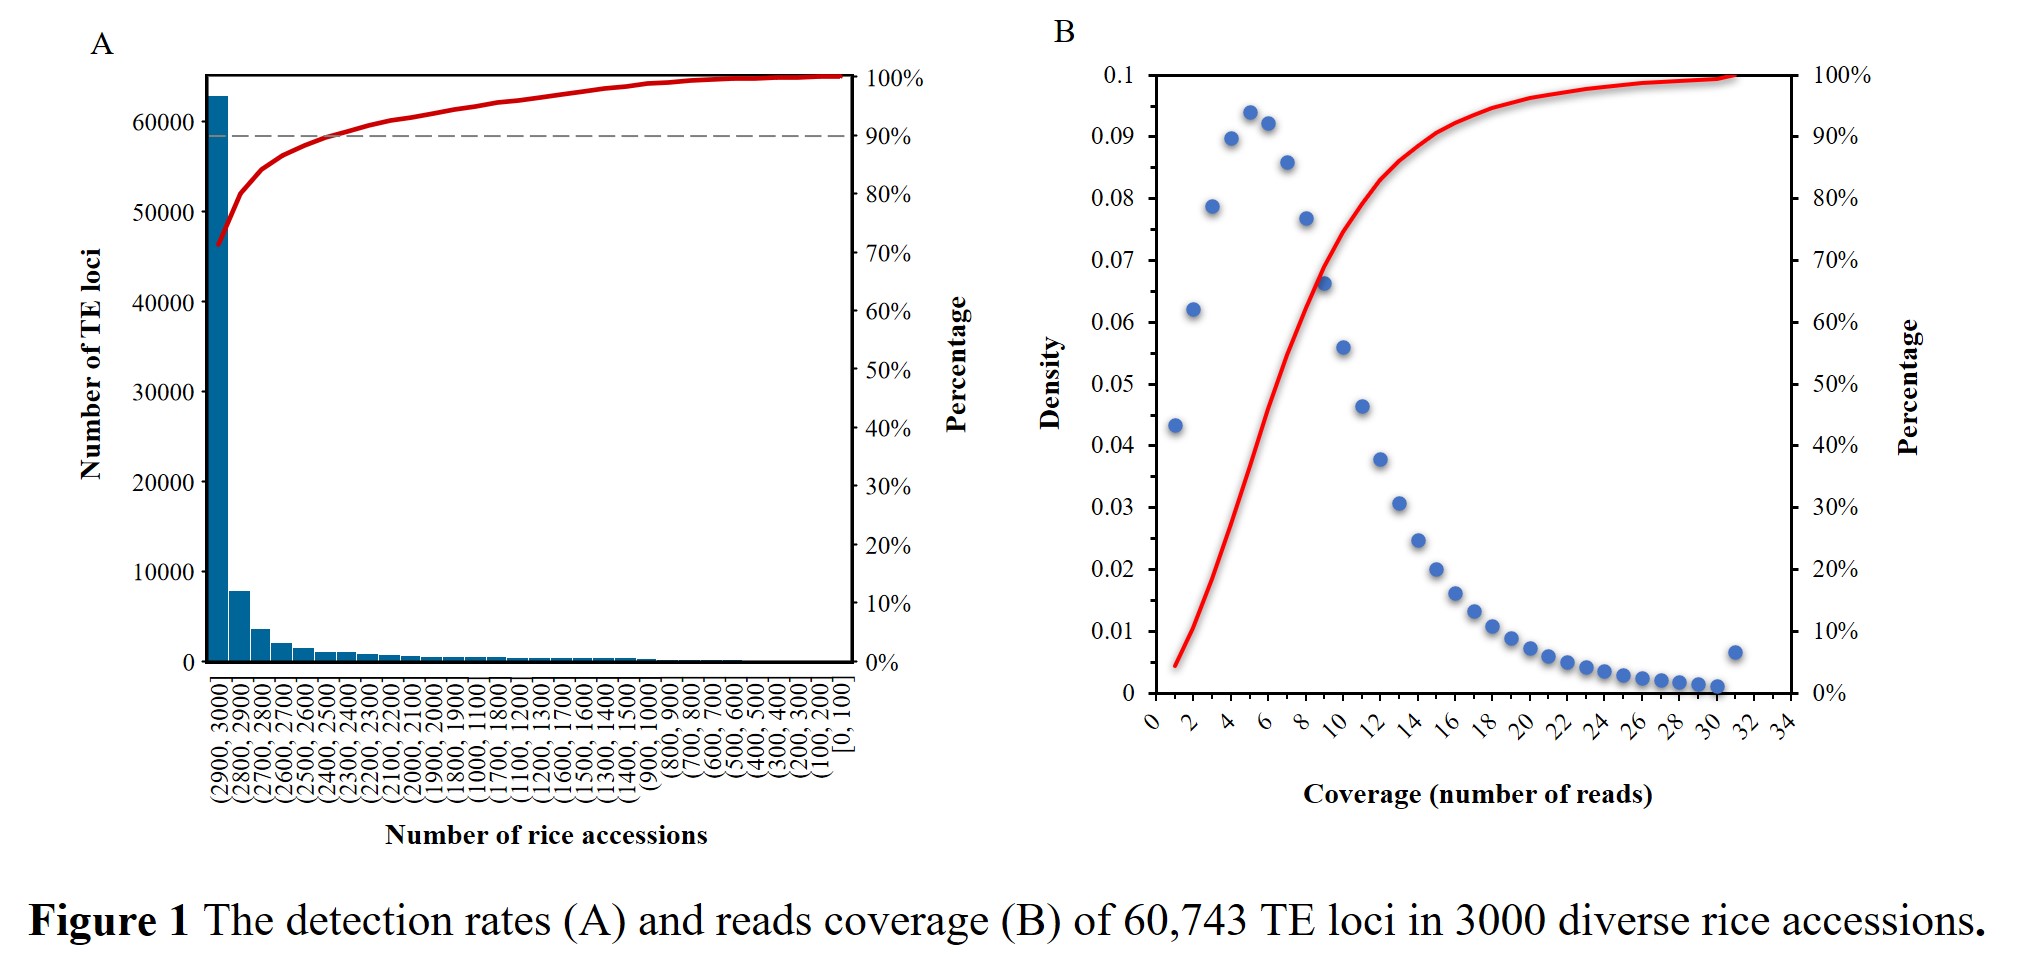
With average sequencing depth of 14×, there must be a small number of TE loci lacking the corresponding chimeric reads spanning the breakpoints in these resequenced rice accessions. Through the survey of the TIPs profile, we observed that approximately 90% of the 60,743 TE loci have been detected in at least 2400 (80%) accessions (Figure 1 A), and the overall detection rate of TE loci was up to 93.1%, which was very close to the average genome coverage (94.0%) and mapping rates (92.5%) of the resequencing dataset. Furthermore, for 90% of all TE calls, there were at least 3 reads supporting the presence or absence of TE insertions (Figure 1 B), and the average number of supporting reads was 7.4 for each call. These results confirmed that our method possessed very high sensitivity and stability.
In addition, we adopted the following three computational or experimental based strategies to evaluate the accuracy and reproducibility of our dataset:
(1) With the availability of Nipponbare and Minghui 63 reference genome assembly, we can determine whether TE insertion does occur at any given loci in these two accessions by scanning the assembled genome sequences, and then compare this result with that called out by NGS reads. As a result, the consistency of genotypes between the two datasets at 1,000 randomly selected loci were 98.8% and 97.9% in Nipponbare and Minghui63, respectively, indicating high accuracy of our method.
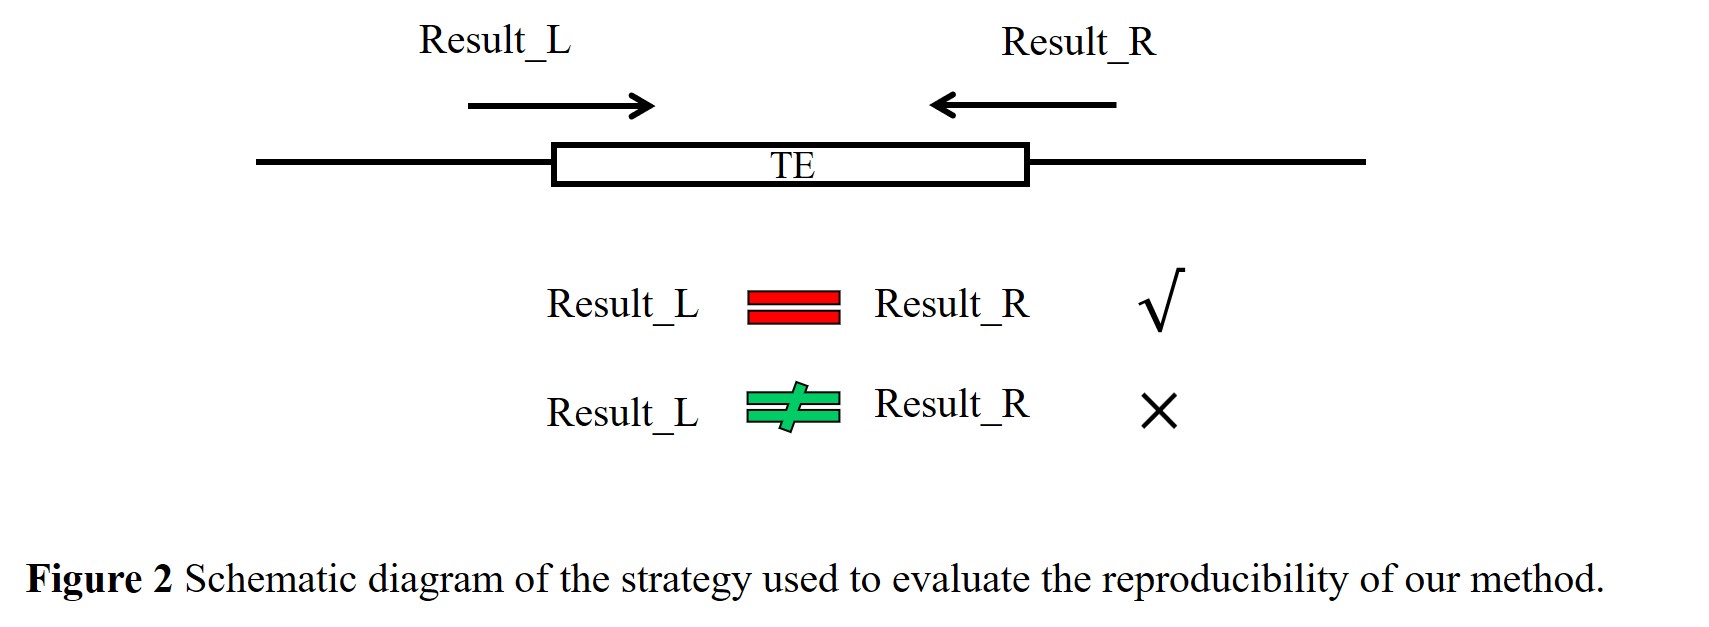
(2) In our dataset, 26,373 TE loci were detected simultaneously from the forward and reverse directions around the insertion sites (Figure 2). Since the result on either side of TE insertion represented independent detections of the corresponding TE insertion, we can evaluate the reproducibility of our method by calculating the concordance between the two results obtained from both ends. By comparing the presence/absence status of these TE loci in the 3,000 resequenced accessions, we revealed a nearly perfect concordance (99.9%) between the two results obtained from both ends of the same insertion sites, which implied excellent reproducibility of our method.
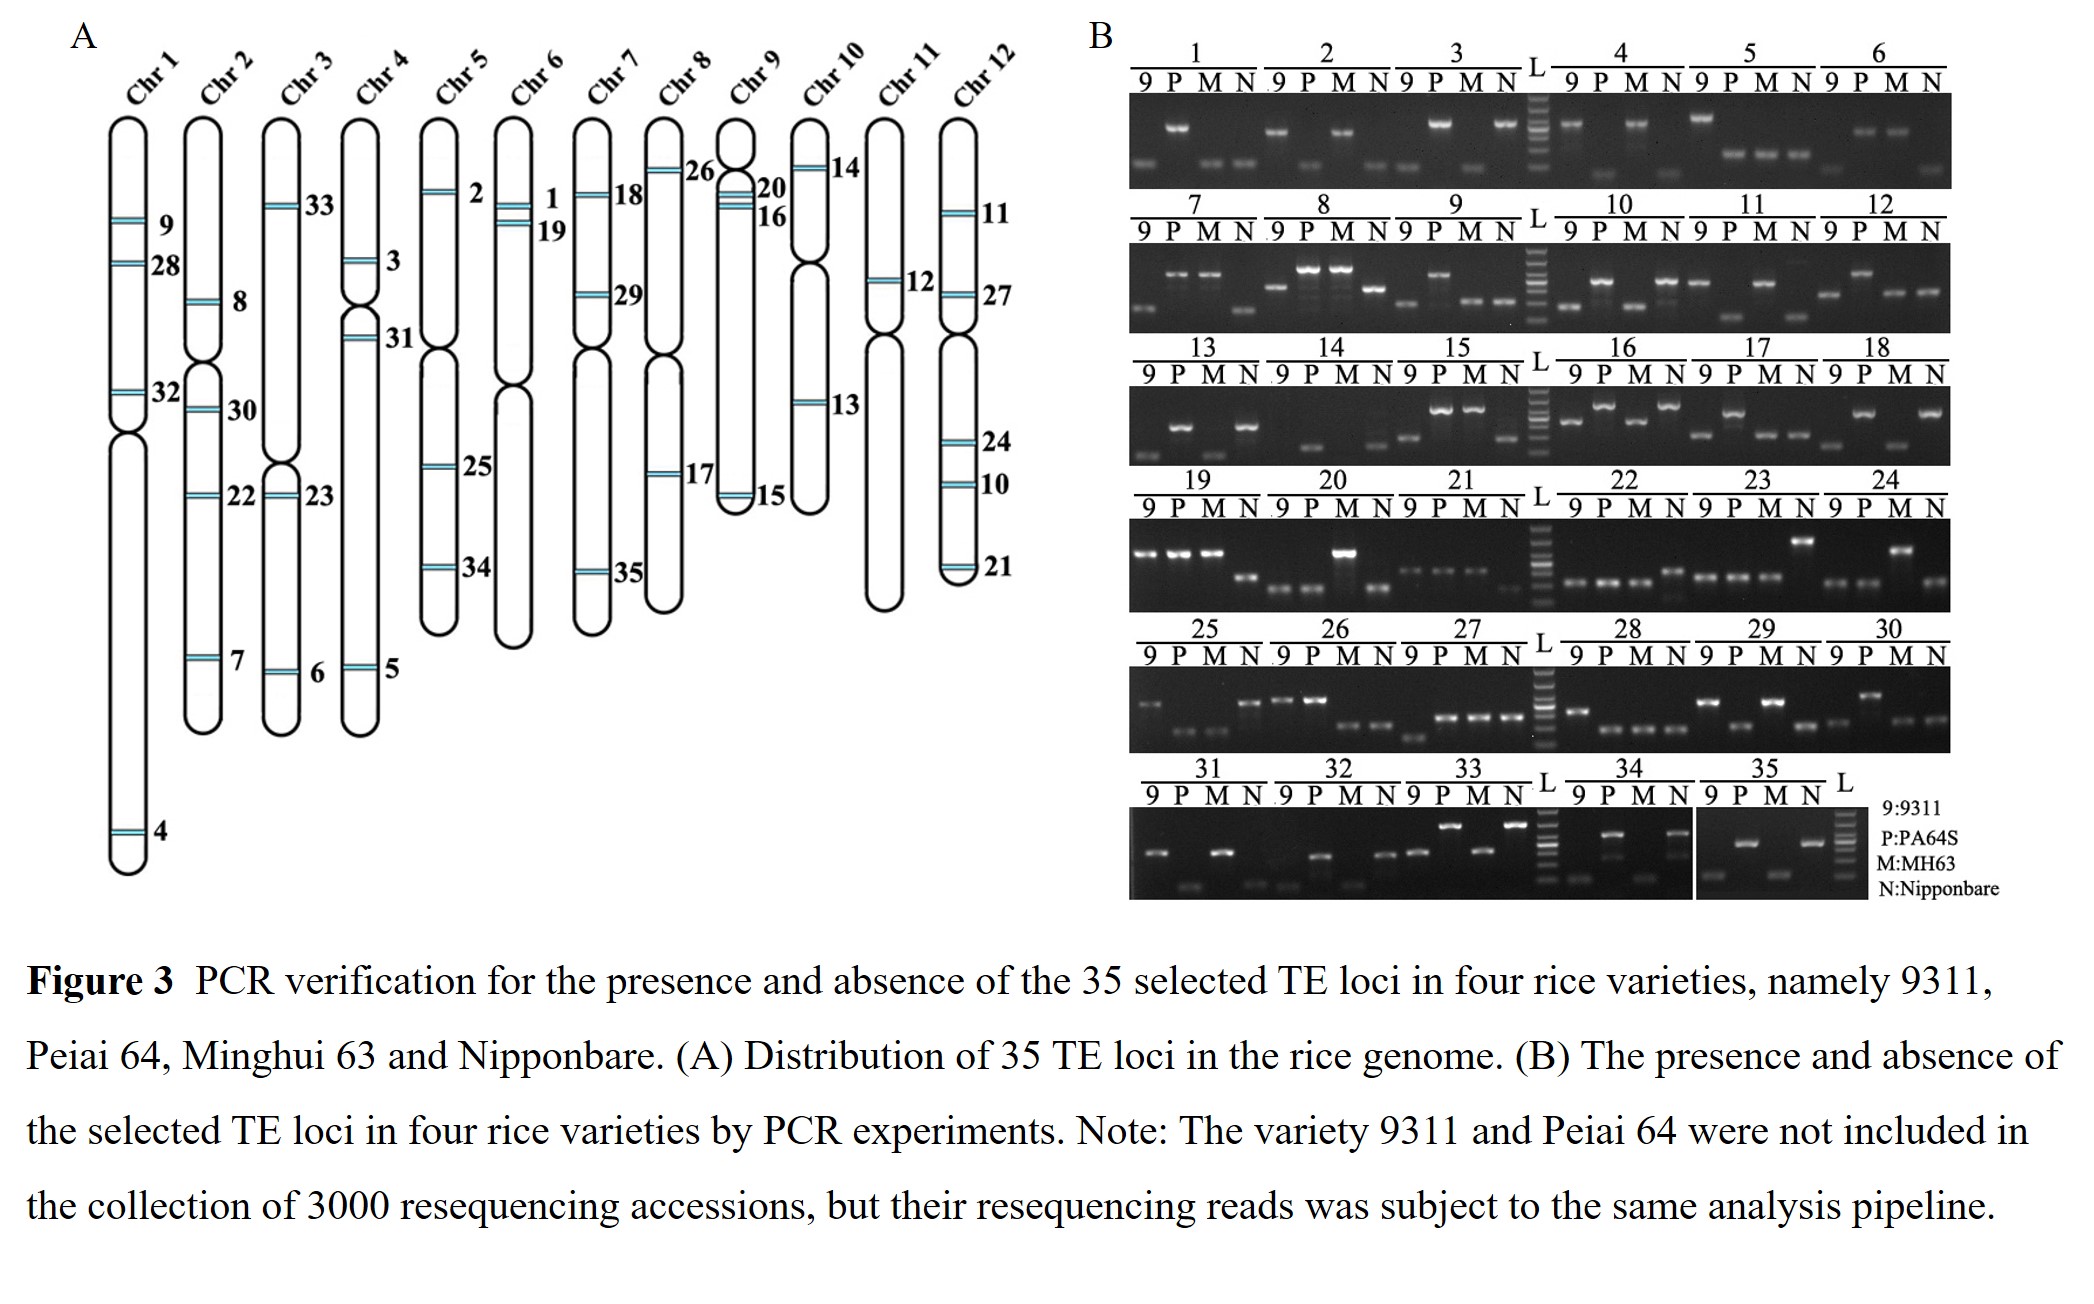
(3) To further confirm the reliability of our method, we first selected thirty-five TE loci identified from both forward and reverse directions around the insertions (Figure 3; Table S1), which were expected to possess intact copies and unique flanking sequences at both end. Then,their presence and absence were detected by PCR amplification in four rice varieties available in our lab. Except for two locus (the 14th and 32th in Figure 3, which failed to be amplified in the variety 9311 and Minghui63), all loci were successfully amplified in the four samples and produced specific bands with the expected size. With closer comparison of the genotypes from NGS reads to that from PCR detection, we found that the presence and absence status for all examined loci was consistent between the two results from different methods. Altogether, we could conclude that the method developed in this study was reliable to detect the presence and absence of TEs at the population level.